If you underwrite, finance or build NYC affordable housing, the income mix of the pipeline matters as much as the unit count. A new TRD Data analysis shows that mix shifting fast, and the next two years could look very different from the last five.
In this post, I walk through what TRD reported, put the numbers in a table, explain what is driving the swing and share what I would watch. Where I add analysis, I will say it is my view. Where I do math, I will label it as mine.
The Headline Numbers
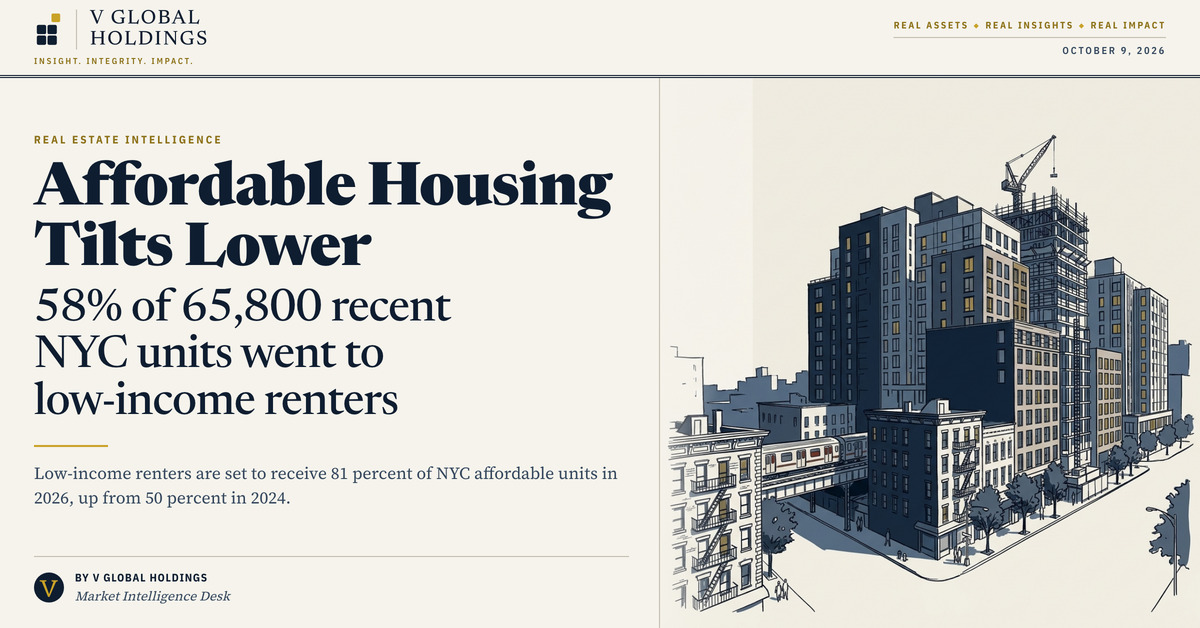
From 2021 to 2026, New York has built or is building about 65,800 affordable housing units across its five boroughs, per TRD’s analysis of city data. The research is credited to Matthew Elo, with the story by Mary Diduch.
Of those units, 58 percent went to extremely low-income, very low-income or low-income renters. TRD defines that group as households with income up to 80 percent of area median income (AMI). As an example, TRD says that could include a family of three earning up to $122,160 a year.
Developers allocated another 41.5 percent to middle-income and moderate-income renters, or those between 81 and 165 percent of AMI.
My own math: 58 percent of 65,800 is roughly 38,200 units for the three lowest income tiers. That is my arithmetic on TRD’s rounded figures, so treat it as an estimate.
The Year-by-Year Swing
The five-year average hides a sharp trend. TRD reports that the share of units geared for low-income renters has fluctuated over the years.
| Year | Share to extremely low, very low and low-income renters |
|---|---|
| 2024 | 50 percent |
| 2025 | 64 percent |
| 2026 | 81 percent (set to hit) |
My own math: that is a 14-point jump from 2024 to 2025 and a 17-point jump from 2025 to 2026. Across the two steps, the share rises 31 points.
TRD also notes that in fiscal year 2026 the city increased starts of extremely low-income and very low-income units by 10 and 9 percentage points year over year, respectively, citing the mayor’s management report. Completions for both income groups also rose.
Why the Mix Is Moving: 421a vs. 485x
TRD quotes Brendan Cheney, director of policy and operations at the New York Housing Conference, on the driver. The share of lower-income units moves with how many 421a units are in the mix.
According to the reporting:
- Most units supported by 421a, the now-expired housing tax incentive program, were moderate- and middle-income.
- Directly subsidized housing is likely to serve lower-income renters.
- The more recently passed 485x program has caps on renter income, and affordable units must remain so in perpetuity.
Cheney expects that to change the mix going forward.
“You’ll see fewer moderate-, middle-income units, assuming that no other policies change.” — Brendan Cheney, New York Housing Conference
My view: if you built your pro forma around moderate- and middle-income rents, this is the line to read twice. The program structure, not just the market, is steering who the units are for.
Borough by Borough
TRD ranked boroughs by their share of units for the three lowest income tiers over the past five years.
| Borough | Share to lowest three tiers | Approx. units |
|---|---|---|
| Brooklyn | More than 65 percent | About 16,200 |
| Manhattan | 64 percent | Roughly 6,400 |
| Staten Island | Excluded from this analysis | 422 total affordable units |
Brooklyn led. Manhattan followed. TRD excluded Staten Island from this part of the analysis because it saw considerably fewer affordable units overall, just 422 across the five years. The reporting does not give figures for the other boroughs, so I will not guess at them.
My own math: Brooklyn’s roughly 16,200 units are about 2.5 times Manhattan’s roughly 6,400. Both are rounded figures from TRD, so that ratio is approximate.
The Fast-Track Districts
Geography is also in play. TRD reports that the Department of City Planning recently implemented a fast-track process to accelerate affordable housing construction more equitably across the city.
The department identified 12 community board districts that produced the lowest number of units from 2021 to 2025. Some of those districts produced fewer than 10 units a year. Most of the fast-tracked districts lie in Queens.
Cheney told TRD: “We think it’ll be really helpful to ensure that housing is being developed in all neighborhoods, that all neighborhoods are contributing to addressing this crisis.”
This effort is part of Mayor Zohran Mamdani’s Block by Block housing initiative. The administration pledges to build 200,000 new affordable homes and preserve and stabilize another 200,000 existing homes over the next decade. My own math: that is 400,000 homes in total across the two pledges.
Starts Slowed, Completions Climbed
One more data point for anyone tracking delivery. In fiscal year 2026, which ran from July 2025 to June 2026, TRD reports a slowdown in affordable housing starts. Completions, however, climbed to the second-highest total at 26,971 units.
I read that as a pipeline in two different phases. The completions number reflects projects already underway, while the slowdown in starts is the figure that shapes future deliveries. That is my interpretation, not a claim TRD makes.
What I Would Watch
This section is my view, not TRD’s.
1. Whether 81 percent holds. TRD says 2026 is set to hit 81 percent for lower-income groups. I would watch whether the final numbers land there.
2. The starts trend. With starts slowing in FY 2026, the question is whether the income mix improves while volume stays flat.
3. 485x underwriting. Income caps and affordability in perpetuity change the revenue side of a deal. I would want to see how sponsors are pricing that.
4. Fast-track district results. The 12 districts produced very few units. Output there will show whether the process moves the needle.
Operator Takeaways
- Developers: the unit mix is moving toward lower-income tiers, and Cheney ties that to program design. Model the tier your program actually requires.
- Lenders and investors: a pipeline weighted to lower incomes is a different credit story than one weighted to middle incomes. That is my view.
- Brokers and land owners: the fast-track districts, mostly in Queens, are where the city is trying to add supply.
- Everyone: the five-year 58 percent figure is an average. The yearly numbers (50, 64, 81) tell the real story.
The Bottom Line
NYC’s recent affordable housing leaned toward lower-income renters, with 58 percent of about 65,800 units going to households at or below 80 percent of AMI. Brooklyn leads on share, completions hit 26,971 in FY 2026, and the shift from 421a to 485x points to an even lower-income mix ahead.
If you work in this space, bookmark the yearly shares and not just the five-year total. I will be tracking the 2026 final numbers.
Operators, here is my question for you: as 485x income caps replace 421a’s moderate- and middle-income units, are you re-underwriting your affordable deals, or waiting to see how the pipeline settles?